 5 minutes
Record high 9M18 reported Net Income (+32%) and exports; stronger profitability, increased production and sales in 3Q18. |

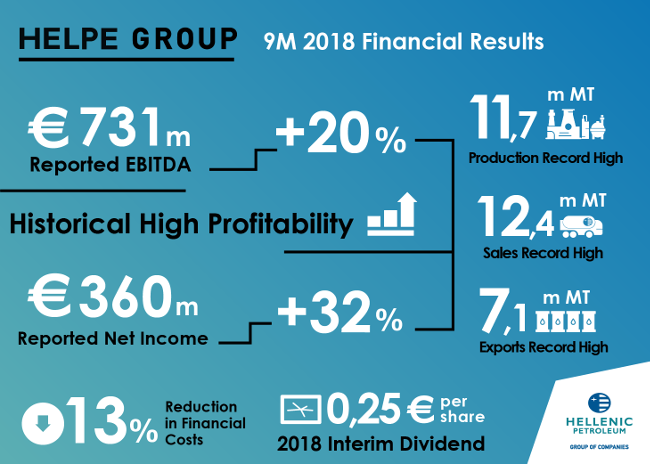
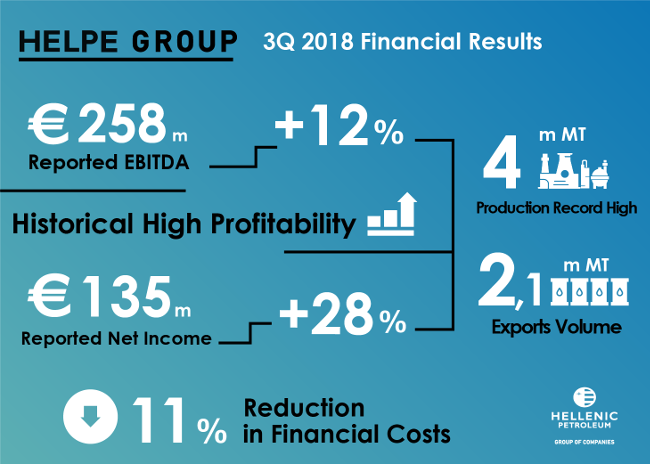
HELLENIC PETROLEUM Group announced its 3Q and 9M financial results. 3Q18 Reported EBITDA came in at €258 m (+12%), leading 9M to a record high of €731 m (+20%). IFRS Reported Net Income amounted to €135 m (+28%) in Q3 and €360 m (+32%) in 9M, the highest on record, with Earnings per Share (EPS) at 1.18.
Higher sales volumes and crude prices led 9M18 sales revenues at €7.3 bn (+ 25%).
Likewise, excluding the impact of increasing crude oil prices on inventory and one-off items, 3Q18 Adjusted EBITDA reached €237m, (+15%), while 9M18 came in at €574 m, with Adjusted Net Income at €111m (+25%) in 3Q18 and €239m in 9M18 (-23%).
The main driver for improved 3Q18 operating profitability was strong refining performance which, through increased mechanical availability, normalised operations and optimal crude selection, delivered the highest ever overperformance vs benchmark refining margins of $7.3/bbl. Equally, the significant increase in production vs 3Q17 (4m MT, +19%), led total sales higher by 8% and exports by 27%. Operating performance outweighed the significant decline in benchmark refining margins by 20%, as well as the cost of increased CO2 emissions rights provisions. Regarding feedstock supply, following the re-imposition of US sanctions, the Group substituted Iranian crude with alternative crude oil types, a switch that did not affect performance adversely.
As a result, 9M18 production rose to 11.7 m tons (+ 5%) and sales volumes to 12.4 m tons (+ 3%) with exports at 7.1 m tons, accounting for 57% of total sales.
The Group’s financial position strengthened further, with finance cost 13% lower in 9M18 and 11% in 3Q18, following the successful completion of the 2018 refinancing program.
3Q18 operating cashflow (Adj. EBITDA – Capex) amounted to €203 m, the highest since 1Q17, bringing Net Debt at €1.8bn, lower q-o-q and gearing at 40%, the lowest level in the last 2.5 years.
Based on 9M18 reported results, the Board of Directors approved the distribution of €0.25/share as interim dividend for 2018.

High and volatile crude oil prices, strong USD sustained
US sanctions on Iran, combined with increased production in North America, led 3Q18 crude oil prices averaging $76/bbl, flat vs 2Q18, but significantly higher compared to 3Q17 (+46%). Prices were volatile, recording their highest level since 2014, at the end of 3Q18.
Macro and political developments in Eurozone and the US resulted in a further strengthening of USD against the euro q-o-q, averaging $1.16, flat vs 3Q17 ($1.17).
Product cracks, excluding diesel, were weaker compared to 3Q17, leading the Med benchmark refining margins 20% lower, with FCC benchmark at $5.7/bbl vs $7.1/bbl last year, while decline was lower for Hydrocracking margins, which averaged $5.6/bbl (3Q 2017 $5.9/bbl).
Increased aviation fuels demand
Total domestic fuels demand was 1.6 m tones, - 1% vs 3Q17. The marine and aviation market recorded an increase of 3%, with a significant improvement in aviation fuels market (+ 10%), due to tourism.
Important developments
In E&P, the lease agreements for "Block 10 - Kyparissiakos Gulf" (HELPE 100%) and two offshore areas west and southwest of Crete, (HELPE 20%, Total 40% - operator, ExxonMobil 40%) were finalized, pending formal signing and customary approvals.
With regards to DESFA sale, the spin-off of DESFA from DEPA through an in kind share capital reduction of DEPA, in exchange for DESFA shares to owners HRADF and HELPE is in process, while the certification of DESFA from energy regulatory authorities is pending. The transaction is expected to be completed in the next quarter. The proceeds of the sale, net of applicable taxes, will be applied mostly towards repaying existing debt, while an extraordinary dividend may also be considered.
In the context of DEPA Group’s reorganization of distribution and marketing activities, the acquisition of remaining 49% of EPA and EDA Attikis from Attiki Gas (subsidiary of Shell Gas BV) is expecting approvals from competition authorities.
Key highlights and contribution for each of the main business units in 3Q18 were:
REFINING, SUPPLY & TRADING
- Refining, Supply & Trading 3Q18 Adjusted EBITDA at €173m (+25%), with 9M18 at €423 m (-17%).
- The improved operation of the refineries in 3Q18 led to an increase in production and sales to 4 m tons (+19%) and 4.1 m tons (+8%) respectively.
- HELPE 3Q18 realised margin amounted to $12.1/bbl, mainly on taking advantage of opportunities in crude pricing structure.
- Crude slate differentiation had an impact on product yields as well, with middle distillates at 52%, while fuel oil was reduced at 10%.
PETROCHEMICALS
- Higher sales volumes of polypropylene (+5%) and increased contribution of the Aspropyrgos refinery propylene unit led to increased profitability, with Adjusted EBITDA at €25 m (+5%).
MARKETING
- 3Q18 Marketing Adjusted EBITDA at €42 m and 9M18 at €81 m.
- Increased aviation fuels volumes maintained 3Q18 profitability at similar levels vs 3Q17, with Domestic Marketing Adjusted EBITDA at €26 m (-3%).
- Weaker margins in most markets where the Group operates, had a negative impact on International Marketing profitability, with 3Q18 Adjusted EBITDA at €16 m (-14%).
ASSOCIATED COMPANIES
- DEPA Group participation to consolidated Net Income came in at €7m.
- Elpedison EBITDA amounted to €4 m (+82%), due to improved Retail contribution.
Key consolidated financial indicators (prepared in accordance with IFRS) for 3Q18 are shown below:
| € million | 3Q17 | 3Q18 | % Δ | 9M17 | 9M18 | % Δ |
| P&L figures | ||||||
| Refining Sales Volumes (‘000 ΜΤ) | 3,787 | 4,087 | 8% | 11,991 | 12,354 | 3% |
| Sales | 1,823 | 2,674 | 47% | 5,888 | 7,341 | 25% |
| EBITDA | 230 | 258 | 12% | 608 | 731 | 20% |
| Adjusted EBITDA 1 | 206 | 237 | 15% | 663 | 574 | -14% |
| Net Income | 106 | 135 | 28% | 273 | 360 | 32% |
| Adjusted Net Income 1 | 89 | 111 | 25% | 313 | 239 | -23% |
| Balance Sheet Items | ||||||
| Capital Employed | 4,142 | 4,421 | 7% | |||
| Net Debt | 1,811 | 1,773 | -2% | |||
| Debt Gearing (ND/ND+E) | 44% | 40% |
Notes:1. Calculated as Reported adjusted for inventory effects and other non-operating items.
Further information:
V. Tsaitas, Investor Relations Officer
Tel.: +30-210-6302399
Email: [email protected]